
Page 77 - Global Power Turkish Defence Industry
P. 77
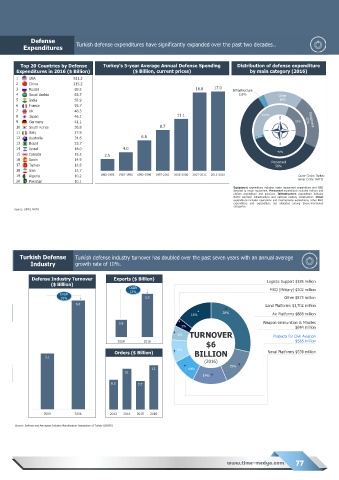
Defense
         Expenditures       Turkish defense expenditures have significantly expanded over the past two decades..


        Top 20 Countries by Defense   Turkey's 5-year Average Annual Defense Spending   Distribution of defense expenditure
       Expenditures in 2016 ($ Billion)         ($ Billion, current prices)              by main category (2016)
       1   USA             611.2
       2   China           215.2
       3   Russia          69.2                                       16.8  17.0   Infrastructure
       4   Saudi Arabia    63.7                                                      2.6%          Other
       5   India           55.9                                                                    16%
       6   France          55.7
       7   UK              48.3
       8   Japan           46.1                                11.1                          34.5%
       9   Germany         41.1                                                                          23%
       10  South Korea     36.8                          8.7
       11  Italy           27.9
       12  Australia       24.6                    6.5
       13  Brazil          23.7
       14  Israel          18.0             4.0
       15  Canada          15.2       2.5                                                         40%
       16  Spain           14.9                                                                 Personnel
       17  Turkey          14.8                                                                   59%
       18  Iran            12.7
       19  Algeria         10.2     1982-1986  1987-1991  1992-1996  1997-2001  2002-2006  2007-2011  2012-2016  Outer Circle: Turkey
       20  Pakistan        10.1                                                                           Inner Circle: NATO
                                                                                   Equipment expenditure includes major equipment expenditure and R&D
                                                                                   devoted to major equipment. Personnel expenditure includes military and
                                                                                   civilian expenditure and pensions. Infrastructure expenditure includes
                                                                                   NATO common infrastructure and national military construction. Other
                                                                                   expenditure includes operations and maintenance expenditure, other R&D
                                                                                   expenditure and expenditure not allocated among above-mentioned
                                                                                   categories.
      Source: SIPRI, NATO


        Turkish Defense    Turkish defense industry turnover has doubled over the past seven years with an annual average
            Industry       growth rate of 10%.

            Defense Industry Turnover    Exports ($ Billion)
                   ($ Billion)                                                                 Logistic Support $335 million
                                              CAGR                                              MRO (Military) $202 million
                                               13%
                      CAGR
                      10%                           2.0                                              Other $873 million
                            6.0                                                               Land Platforms $1,702 million
                                                                    15%        28%               Air Platforms $888 million
                                           0.8                                               Weapon-ammunition & Missiles
                                                                 3%                                      $844 million
                                                                    TURNOVER
                                                               6%                                Products for Civil Aviation
                                                                         $6
                                          2009      2016                                                 $585 million
                                                               9%
                                         Orders ($ Billion)          BILLION                   Naval Platforms $539 million
                 3.1
                                                                         (2016)
                                                                                  15%
                                                      12           10%
                                             11
                                                                        14%
                                        8.0      7.7


                2009       2016         2013  2014  2015  2016

      Source: Defense and Aerospace Industry Manufacturer Association of Turkey (SASAD)


                                                                                 www.time-medya.com      77